
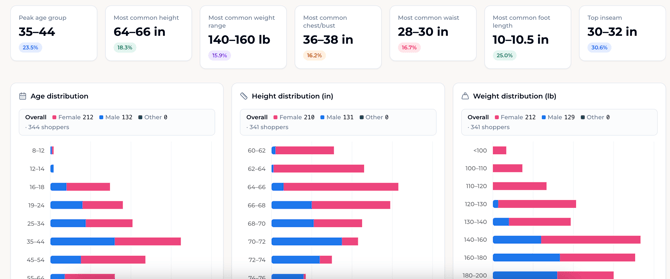
Use this report to identify the most common characteristics of shoppers engaging with your products, including age, gender, height, weight, and key body measurements.
How to access
The Shopper Demographics Report is available under the "Reports" section off the Connect portal. Click "Reports > Shopper Demographics".
Who should use this dashboard?
This report is designed for teams responsible for:
- Merchandising
- Buying
- Product Development
- Technical Design
- Ecommerce
- Customer Experience
- Marketing & Customer Insights
When to use this report
Use this report to:
- Better understand the demographics of your True Fit shoppers.
- Identify the most common body measurements across your customer base.
- Compare shopper profiles across brands, departments, or categories.
- Inform product assortment, merchandising, and fit decisions.
- Understand differences in shopper demographics across markets or devices.
How this dashboard works
The Shopper Demographics Report aggregates anonymized True Fit shopper profile data to provide a snapshot of the customers interacting with your products.
Rather than analyzing purchasing behavior, this report summarizes shopper characteristics—including age, gender, height, weight, and body measurements—to help you better understand your customer population.
Results can be filtered by product attributes, geography, device type, and other dimensions to support more targeted analysis.
Why this matters
This report reflects shoppers who have created a True Fit profile—an audience that is typically more engaged and often converts at higher rates than the average site visitor.
While this may represent a subset of your overall traffic, it provides valuable insight into the body measurements and demographics of shoppers who actively seek fit confidence during their purchase journey.
Understanding the report
1 - Filters
Use the filters at the top of the report to narrow your analysis.
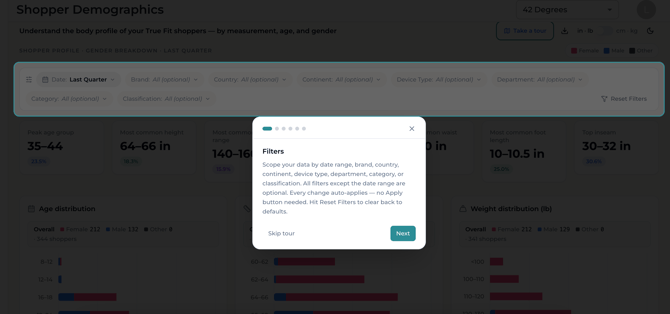
Example use cases:
- Compare shopper profiles across product categories.
- Analyze shoppers within a specific country.
- Understand body measurements by department.
- Compare demographics across brands.
Available filters include:

|
Filter |
Description |
|
Date |
Select the time period. Defaults to Last Quarter |
|
Brand |
Filter by a specific brand or view all brands together |
|
Department |
Filter by department (e.g. Women's, Men's) |
|
Category |
Narrow to a product category (e.g. Bottoms, Tops) |
|
Class |
Narrow to a product classification (e.g. T-Shirts, Blazers, hoodies, etc.) |
|
Country / Continent |
Narrow results to a geographic region) |
|
Device Type |
Filter by the device shoppers used (e.g. mobile, desktop) |
|
Classification |
Further refine by product classification if available |
|
in / cm toggle |
Switch waist measurement display between inches and centimeters |
2. Summary Cards
The summary cards provide a snapshot of the most common shopper characteristics within the currently selected filters.
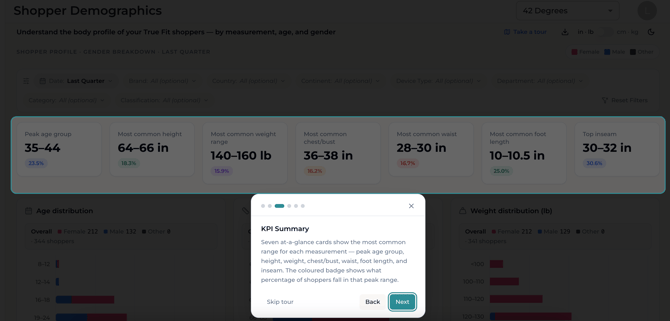
Peak Age Group
-
- The age range representing the largest share of shoppers.
- Use this to understand the primary age demographic engaging with your products.
Most Common Height
-
-
The height range most frequently reported by shoppers.
-
Most Common Weight Range
-
-
The weight range most commonly represented in the selected shopper population.
-
Most Common Chest/Bust
-
- The most frequently reported chest or bust measurement.
Most Common Waist
-
- The most frequently reported waist measurement.
Most Common Foot Length
-
- The most common foot length among shoppers.
Top Inseam
- The inseam range is most commonly reported by shoppers.
Note: The percentage displayed beneath each summary card represents the share of shoppers that fall within that most common demographic or body measurement range.
Reading the Distribution Charts
Each chart displays the distribution of shoppers across a specific demographic or body measurement.
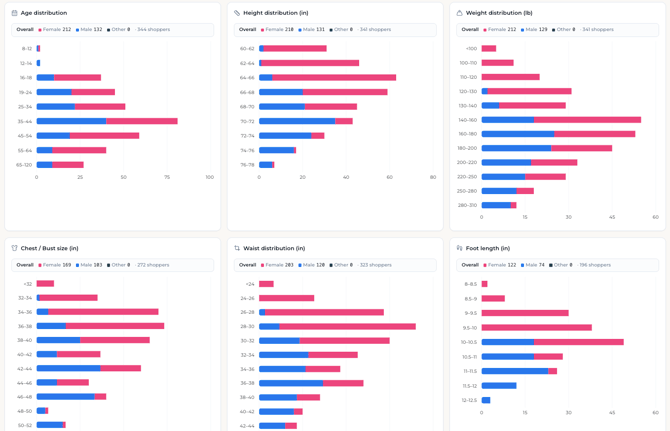
*based on anonymized sample data
Examples include:
- Age
- Height
- Weight
- Chest/Bust
- Waist
- Foot Length
- Inseam
What you're seeing
- Each horizontal bar represents a measurement or demographic range.
- The length of each colored segment represents the number of shoppers within that range.
- Bars are segmented by gender, allowing you to compare shopper distributions across demographic groups.
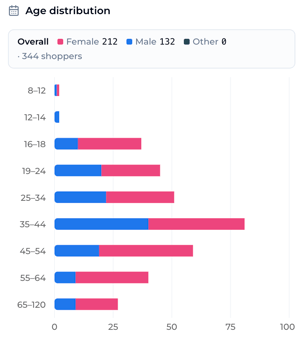
1 - Gender Legend
|
Color |
Represents |
|
Pink |
Female |
|
Blue |
Male |
|
Gray |
Other |
2 - Hover Details
Hover over any bar to view the underlying shopper counts by gender for that range.
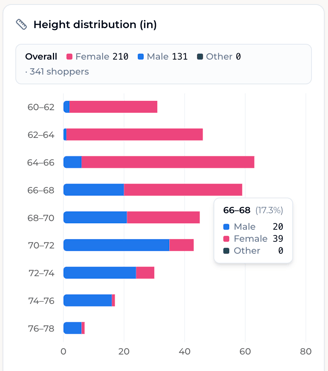
The tooltip displays:
- Measurement range
- Female shoppers
- Male shoppers
- Other shoppers
This makes it easy to understand the composition behind each distribution.
3 - Overall Shopper Count
Each chart includes the total number of shoppers represented based on the current filters.

Use this value to understand the sample size supporting the visualization.
Ways to Use This Report
The Shopper Demographics Report helps teams better understand their shoppers and make more informed decisions about merchandising, marketing, inventory, and product.
|
Team |
Questions this report can help answer |
|
Marketing & Creative |
|
|
Merchandising & Buying |
|
|
Product Development & Technical Design |
|
|
Inventory Planning |
|
|
Ecommerce & Customer Experience |
|
How True Fit can help
Understanding your shopper population can help you make more informed merchandising and fit decisions.
|
If you discover... |
Consider... |
How True Fit can help... |
|
Your shopper body measurements differ significantly from your current size charts. |
Review body measurement mappings. |
Dynamic Size Charts can better align displayed body measurements with your actual shopper population. |
|
Shopper demographics vary across categories or regions. |
Evaluate whether fit guidance should differ across assortments. |
General Guidance helps communicate category-specific fit information based on shopper purchasing behavior. |
|
A category serves a unique shopper profile. |
Review fit expectations and merchandising strategy. |
Use shopper insights alongside Fit Consistency and General Guidance to better understand how those shoppers purchase across the assortment. |
Best Practices
To get the most value from this report:
- Compare shopper profiles across departments and categories.
- Review multiple body measurements rather than focusing on a single attribute.
- Consider sample size when interpreting distributions.
- Use demographic insights alongside purchase behavior reports to gain a more complete understanding of your shoppers.
Limitations
- Results reflect shoppers who have created or shared a True Fit profile.
- Recently added products or categories may have limited shopper data.
- Results are based on the currently selected filters.
- Shopper demographics may evolve over time as your customer base changes.
Frequently Asked Questions
- Why don't the totals match across every chart?
- Some body measurements are optional or only collected for relevant product categories, so the total number of shoppers may vary between charts.
- Why are some measurement ranges empty?
- No qualifying shoppers were present in that measurement range for the selected filters.
- Can I compare different brands or categories?
- Yes. Use the available filters to compare shopper demographics across brands, departments, categories, and geographic regions.
- Can I export this report?
- Yes. Reports can be downloaded as CSV or JSON Lines.
- Who are the shoppers included in this report?
- The report covers shoppers who have registered with True Fit and provided body measurement data. Only True Fit registered users are included — unregistered or guest shoppers are not reflected in this data.
- What does the percentage shown on each KPI badge mean?
- The percentage represents the proportion of shoppers whose measurement falls within that peak range. For example, 26.3% for the 35–44 age group means roughly one in four shoppers falls within that age band.
- Why do the shopper counts differ between charts?
- Not all shoppers provide every measurement when registering. For example, a shopper may enter height and weight but not foot length. Each chart only counts shoppers who have provided data for that specific measurement, which is why totals vary.
- Can I filter the report by a specific brand or country?
- Yes. Use the Brand, Country, and Continent filters at the top of the dashboard to narrow the data. All charts update automatically when a filter is applied.
- What time period does this report cover?
- By default, the report shows data for the Last Quarter. You can change the date range using the Date filter to view a different period. It has data for all time registered shoppers.
- How can I switch between inches/pounds and centimetres/kilograms?
- Use the unit toggle in the top-right corner of the dashboard (in · lb / cm · kg). All charts and KPIs update immediately when toggled.
- Can I use this data to inform sizing decisions?
- Yes. This report is designed to support size range planning, grading decisions, and size guide content. By understanding where the majority of your shoppers sit across key measurements, teams can ensure their size ranges cover the core customer body profile.
- For a shopper registering or buying shoes, will I also see his chest or inseam information in this report?
- Yes, if the shopper has provided data for chest or inseam in his closet by entering closet information, then this report will reflect data for these profile sections too.
- Q: How do I download the report?
- Click the Download icon in the top-right corner of the dashboard to export the current filtered view.