
Use the Recommendation Served Report to understand how many True Fit recommendations are being delivered, how that volume is distributed across recommendation types, and how recommendation delivery changes over time.
The report helps teams move beyond total recommendation volume to understand the mix of experiences shoppers are receiving today. That mix can help identify where experience improvements may have the greatest reach and where there is an opportunity to expand richer personalization.
How to access
The Recommendations Served Report is available under the “Reporting Hub” section on the Connect portal. Click “Reports > Recommendations Served Report”.
Who should use this report?
This report is designed for teams responsible for:
- Ecommerce
- Digital Product
- Customer Experience
- Conversion Optimization
- Analytics
- True Fit program management
When to use this report
Use the Recommendation Served Report to:
- Understand the overall scale of True Fit recommendation delivery.
- See how recommendation volume is distributed across Personal, Instant, and General experiences.
- Monitor how recommendation delivery and mix change over time.
- Identify where experience improvements or deeper personalization could have the greatest impact.
- Compare recommendation delivery across product, geography, or device segments.
How this dashboard works
The Recommendation Served Report measures the number of True Fit recommendations delivered during the selected reporting period.
Recommendations are grouped into three experience types:
-
Personal recommendations are individualized recommendations informed by a shopper's True Fit profile and available purchase information.
-
Instant recommendations use available past-purchase information to provide individualized guidance without requiring a registered True Fit profile.
-
General recommendations provide non-individualized guidance based on how other shoppers are buying and keeping the product.
The report shows both total recommendation volume and the percentage of recommendations represented by each type.
Use the filters at the top of the report to narrow the analysis to specific product, geographic, or device segments.
Why this matters
Total recommendation volume tells you how broadly True Fit is being used. Recommendation mix tells you what kind of experience shoppers are actually receiving.
For example, if General recommendations represent a large share of recommendation volume, that means improvements to the General experience could affect a significant portion of True Fit interactions.
At the same time, the relative share of Personal and Instant recommendations provides visibility into the current depth of personalization.
The goal is not simply to increase the number of recommendations served. It is to understand where True Fit is reaching shoppers today and where there may be an opportunity to increase the value of those experiences.
Understanding the Dashboard
1 - Filters
Use the filters at the top of the report to narrow the recommendation data you want to analyze.

Available filters include:
| Filter | Description |
|---|---|
| Period | Select the reporting period you want to analyze. |
| Department | Filter recommendation delivery to a specific department. |
| Category | Narrow the analysis to a product category. |
| Classification | Further refine the product set. |
| Continent | Analyze recommendation delivery within a geographic region. |
| Country | Narrow results to a specific country. |
| Device | Compare recommendation delivery across device types. |
Click Apply to update the report.
2 - Recommendation volume and mix
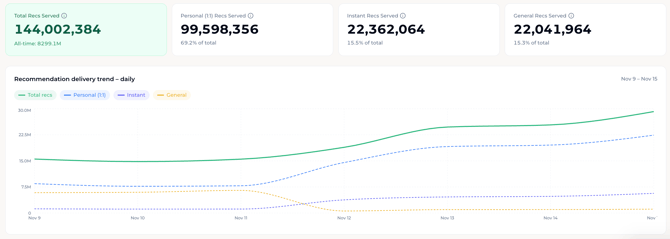
The KPI cards provide a summary of recommendation delivery during the selected period.

-
Total Recs Served
-
The total number of True Fit recommendations delivered during the selected period.
-
The card also shows the cumulative all-time recommendation volume.
-
-
Personal (1:1) Recs Served
-
The number of personalized recommendations delivered to shoppers using their available True Fit profile and purchase information.
-
The percentage beneath the total shows Personal recommendations as a share of all recommendations served.
-
-
Instant Recs Served
-
The number of Instant recommendations delivered using available past-purchase information.
-
The percentage beneath the total shows Instant recommendations as a share of all recommendations served.
-
-
General Recs Served
-
The number of General recommendations delivered during the selected period.
-
General recommendations do not require an individualized shopper profile and are based on broader product and shopper behavior.
-
The percentage beneath the total shows General recommendations as a share of all recommendations served.
-
3 - Interpreting the recommendation mix
The recommendation mix helps teams understand the type of True Fit experience reaching shoppers today.
For example, a large General Guidance share shows that General recommendations currently account for a larger share of recommendation delivery.
That can create two different opportunities.
First, improving the General experience can have significant reach because it affects a large volume of recommendations.
Second, growth in Personal or Instant recommendations can indicate that more shoppers are moving into richer personalized experiences.
Business takeaway: Use recommendation mix as a prioritization signal. Optimize the experience reaching the largest audience today while looking for opportunities to expand deeper personalization over time.
4 - Recommendation Delivery Trend
The Recommendation Delivery Trend shows daily recommendation volume across the selected reporting period.
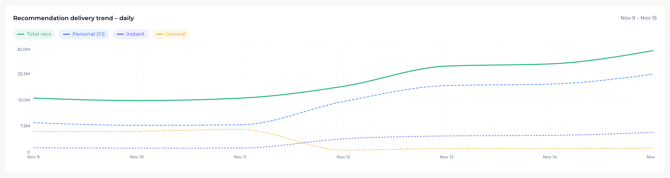
The chart includes:
- Total recommendations
- Personal (1:1) recommendations
- Instant recommendations
- General recommendations
Select or deselect recommendation types in the legend to make individual trends easier to analyze.
Use this view to understand whether recommendation volume or mix is changing over time.
For example, after a new product or category rollout, CTA update, registration improvement, or other experience change, you may see a shift in total recommendation volume or in the balance between General, Instant, and Personal recommendations.
Business takeaway: The daily trend helps teams understand whether product and experience changes are actually changing how True Fit recommendations are being delivered.
Best Practices
To get the most value from the Recommendation Served Report:
- Look at recommendation mix as well as total volume.
- Use the daily trend to monitor meaningful changes after product or experience updates.
- Filter by department, category, geography, or device to identify where recommendation mix differs.
- Use Personal and Instant growth as one signal of expanding personalization coverage.
- Pair this report with performance reporting when you want to understand how recommendation mix relates to business outcomes.
Frequenty Asked Questions
-
What does Total Recs Served mean?
-
Total Recs Served is the total number of True Fit recommendations delivered during the selected reporting period.
-
The all-time figure represents cumulative recommendation delivery over the lifetime of the True Fit experience for the retailer.
-
- What is a Personal recommendation?
-
A Personal recommendation is individualized to the shopper using their available True Fit profile and purchase information.
-
-
What is an Instant recommendation?
-
An Instant recommendation uses available past-purchase information to provide individualized guidance without requiring the shopper to create a registered True Fit profile.
-
-
What is a General recommendation?
- A General recommendation is non-individualized guidance based on how other shoppers are buying and keeping the product.
- Why are General recommendations much larger than Personal or Instant?
- General recommendations can be delivered without requiring a registered or identified shopper, so they can reach a broader audience.
- Personal and Instant experiences require additional shopper information and therefore typically apply to a smaller population.
- Does a high General share mean most shoppers prefer General recommendations?
- No.
- The report shows the type of recommendation that was delivered, not why the shopper received it or which experience they would prefer.
-
Use the mix to understand recommendation coverage and identify areas worth optimizing.
-
Why do the Total and General lines sometimes look almost identical?
- If General recommendations account for most recommendation volume, the General trend will closely follow the Total trend.
- You can hide individual series in the legend to make smaller Personal or Instant trends easier to analyze.
- How should I use recommendation mix to make decisions?
- Look for two kinds of opportunity.
- If one recommendation type represents a large share of total volume, improvements to that experience can have broad reach.
- If richer personalized experiences represent a smaller share than expected, investigate whether there are opportunities to expand personalization coverage.
-
Why did the numbers change after applying a filter?
-
All recommendation totals and trends recalculate for the filtered population.
-
A particular department, category, country, or device may have a different recommendation mix than the retailer overall.
-
-
Can I compare this report with the Business Performance Summary?
-
Yes.
-
The Recommendation Served Report tells you what type of recommendations are being delivered and at what scale.
-
The Business Performance Summary helps you understand how different shopper populations are performing.
-
Used together, they can help connect recommendation coverage with performance and optimization opportunities.
-
-
Can I export the report?
-
Yes. Use Download CSV to export the available report data for additional analysis or sharing.
-
-
Is there a guided walkthrough?
-
Yes. Select Take a tour from the top of the report to launch the guided walkthrough of the controls, recommendation cards, and daily trend.
-